Pandemic Personal Finances Year in Review
May 17, 2021
Each year at tax season, I go through the exercise of adding up all the income my wife and I made over the last year, and each year, I find myself wondering where the heck all that money actually went. As it happens, with nearly all of my spending happening through credit cards, this is actually a fairly easy question to track.
I like to use Personal Capital as a dashboard of my finances and spending. It allows bulk csv download of credit card transactions over any time period with auto-categorization by spending type. In past years, I’ve had fun using this for a little “household finances year in review” data analysis: How often do we go out to eat? What did all that online clothes shopping add up to, net of returns? etc. In addition to being a check on my budgeting and spending, I’ve found that looking through this data is also like a ledger of my behavior, listing all the things I did and places I went.
Reflecting back on the past year is particularly significant this time around, for obvious reasons. San Francisco’s shelter in place order started on March 16th 2020, and a bit over a year later the world feels like it is opening back up again. My habits aren’t quite back to normal, but are getting close: I’ve gone to the gym, sat down inside a restaurant, and even seen a concert (albeit outside). The “quarantine era” lasted, more or less, a year. What does Visa have to say about how my life was changed?
Methods, briefly
Here I’m looking at year-on-year comparisons of my credit card transactions one year before and after the start of shelter in place. So the “normal” period leading up to the pandemic is March 16, 2019 to March 15, 2020, versus the “pandemic” year March 16, 2020 to March 15, 2021.
Personal Capital does an fairly good job of classifying transactions into their categories, but I did some manual data cleaning by scanning through most of the high value transactions and making corrections as needed. Mortgage payments are notably not included, but those are pretty fixed year on year so not very interesting to include.
In the charts below I’m leaving some axis labels blank to preserve a degree of privacy about my finances and exactly how much I spend. But suffice to say that relative comparisons between years are still apparent.
Overall Spending
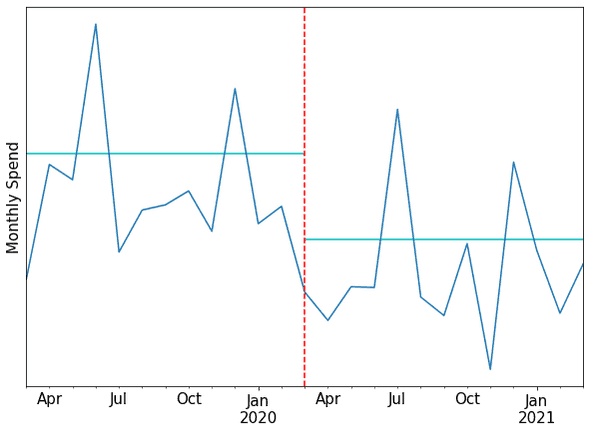
My total household spending dropped 36% during the shelter in place year. July and December 2020 were high spending months due to a few large expenses: booking a getaway house near Point Reyes that we would stay in for the month of September, and getting two of our closets remodeled. But besides those items, each pandemic month spent substantially less than any month in the previous year.
Spending Categories
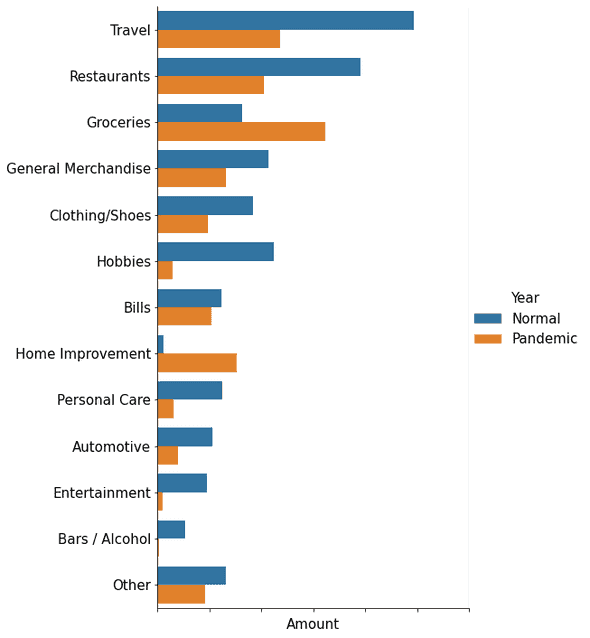
Travel -52%: This was the largest category in 2019 and the biggest delta. We did some big, awesome trips in 2019 and had more lined up for 2020, which were sadly cancelled. Despite everything, travel was still the second largest spending category during the pandemic year because we did a few extended live/work retreats in rental houses in order to get out of San Francisco for a while.
Restaurants -46%: In normal times, we eat out a lot. And even in pandemic times, we apparently still managed to eat out a fair amount: we had to do our patriotic duty to support local small businesses by ordering takeout! At least that’s what I told myself whenever I didn’t feel like cooking.
Bars/Alcohol -94%: I do not want to give the impression I was drinking less. That was, emphatically, not the case. That expenditure merely got shifted from bars to grocery stores.
Groceries +97%: I think this might be the first year of my life that I spent more on groceries than on eating out? As I ate less in restaurants and drank less in bars, there was a corresponding increase in buying groceries. On net, I spent 12.5% less on food and drink overall. I had expected a bigger decrease in total food spending: isn’t making food at home supposed to be cheaper than sitting down at a restaurant? But then my wife reminded me that over the last year I’ve actually had to pay for all of my own meals, instead of having lunch, and possibly breakfast, and possibly dinner as well, provided by work.
General Merchandise -38%: This category is a catchall for non-consumable goods that don’t fall into the other categories. The main reason this category went down is that 2019 saw a few of our computers and phones breaking or coming to the end of their lifecycles in 2019, which resulted in large payments to that one fruit company. Was 2019 general merchandise spending artificially high due to one-off purchases? Or is there possibly a story that sitting around at home means you’re less likely to smash your phone and need to buy a new one? In 2019 I broke one phone when I crashed while mountain biking in Peru, and then a few months later broke another phone by taking too many pictures in the torrential rain in New Zealand. In 2020 I was… not doing things like that. As for other general merchandise: buying random crap off of Amazon was up 32%.
Clothing/Shoes -47%: Not too surprising. I think most of the new clothes I obtained this year were things I tie dyed (but that’s a topic for another post).
Hobbies -87%: This category is mostly just bicycle related things. In 2019 my wife bought a new e-bike and I bought a mountain bike. I think my quiver of bikes is pretty full at this point, so I expect this spending category will stay low for the next few years, or at least until I convince myself that a Moots gravel bike is that one thing that will finally make me happy.
Bills -16%: Comcast, Verizon, State Farm, etc. Not a lot to see here.
Home Improvement +1156%: After not doing much work on the house in 2019, we had some of our closets remodeled. Spending a lot of time in the house definitely increased the motivation to take on that kind of project!
Personal Care -75%: No gym memberships. Fewer haircuts.
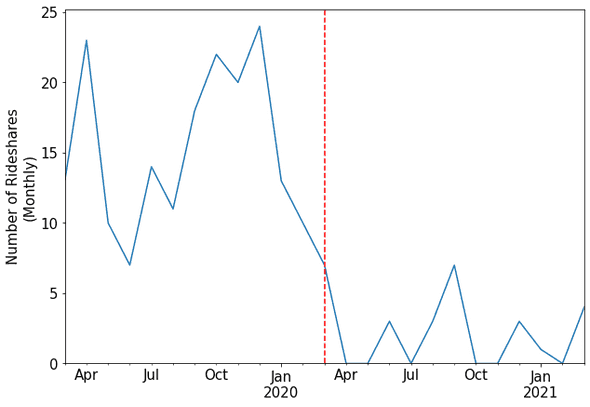
Automotive -62%: This category includes Uber/Lyft rides, gas, public transit, etc. Every type of transit expense was down: we drove less and so spent less on gas; I haven’t taken public transit a single time since shelter in place started, even though that was an almost daily occurrence in the “before times”; and of course, fewer rideshares which normally is a major expense. For the pandemic year, the number of Uber/Lyft rides my wife and I took dropped from 192 to just 21, an 89% decrease. I’m actually surprised to see that it ended up being that many during shelter in place, because I generally wanted to avoid the risk of being in a car with a stranger unless there was a compelling reason to do so.
Entertainment -90%: A year of no concerts, no plays, no festivals. I’m still sad about the King Gizzard & The Lizard Wizard concert that never was. Those tickets got rolled over to this fall, so fingers crossed there won’t be any more world-historical events that get in the way.
Reflections
For the most part, I predict that next year will revert to a lot of the same spending patterns as pre-coivd. It was fun reviewing a lot of the transactions as I was cleaning the data, almost like reading a journal. What was that very large restaurant bill in May 2019? Oh, yeah the Michelin starred restaurant we visited on our last night in Guadaljara… I haven’t thought about that in a while. Or, how about all those sweatpants I ordered one month into shelter in place.
Here’s to spending money on plane tickets and fancy meals again 🥂


